Launching a 4T oil blending plant offers exceptional growth potential with India’s lubricant market valued at USD 4.8 billion in 2025, growing at 4.6% CAGR through 2032. A modest investment of ₹68.91 lakhs yields strong returns with 50% capacity utilization, achieving ₹40.2 lakh annual profit and a break-even point within 18 months.
The Indian lubricants market presents compelling opportunities for entrepreneurs, with the sector valued at USD 4.8 billion in 2025 and projected to reach USD 6.6 billion by 2032 at a robust 4.6% CAGR. The two-wheeler engine oil segment, specifically 4T oils, represents a critical growth driver with the market expanding from USD 1.15 billion in 2024 to USD 1.49 billion by 2031 at 3.8% CAGR.
Market Segment
2025 Value
2032 Projection
CAGR
India Lubricants
USD 4.8B
USD 6.6B
4.6%
Two-Wheeler Oil
USD 1.15B
USD 1.49B
3.8%
Asia 4T Oil
USD 1.6B
USD 2.4B
4.9%
Key growth drivers include rising two-wheeler sales, increasing disposable income, and growing awareness of engine maintenance.
2. Raw Materials: Specifications & Cost Analysis
Primary Raw Materials (Annual Requirements at 100% Capacity)
Material
Quantity
Price per Unit
Annual Cost (₹)
Percentage
Base Oil
432,000 L
₹55/L
23,760,000
90%
Additives
28,800 kg
₹300/kg
8,640,000
6%
Viscosity Index Improver
24,000 kg
₹100/kg
2,400,000
5%
Total Raw Material Cost
–
–
₹34,800,000
100%
Procurement Strategy
Base Oil: Source from major refineries like IOCL, HPCL, or Reliance with 30-day credit terms
Additives: Import from Lubrizol, Infineum, or domestic suppliers like Savita Oil
VI Improver: Procure from Evonik or local chemical manufacturers
Storage: Maintain 30-day inventory for raw materials and 7-day stock for finished goods
3. Machinery & Equipment Investment
Core Production Equipment
Equipment
Capacity/Specs
Quantity
Cost (₹)
Blending Kettle
2,500 L
1
450,000
High-Strength Plastic Tanks
3,000 L
2
135,000
Storage Tanks (Finished Product)
–
2
70,000
Pipeline, Valves & Filters
Complete System
1
50,000
Base Oil Transfer Pumps
–
1
45,000
Blending Equipment Total
–
–
₹750,000
Filling & Packaging Machinery
Equipment
Purpose
Cost (₹)
Filling Machine (500 ML – 5 L)
Automated filling
125,000
Weigh Fill Machine (300 kg)
Bulk packaging
10,000
Induction Sealing Machine
Bottle sealing
20,000
Semi-Automatic Capping
Cap application
12,000
Other Equipment
Miscellaneous
50,000
Packaging Total
–
₹217,000
Total Machinery Investment: ₹967,000
4. Manpower Requirements & Structure
Skilled Personnel
Designation
Count
Monthly Salary (₹)
Annual Cost (₹ lakh)
Plant Supervisor
1
20,000
2.40
Quality Control Officer
1
18,000
2.16
Machine Operators
2
18,000 each
4.32
Skilled Workers
2
18,000 each
4.32
Semi-Skilled & Support Staff
Designation
Count
Monthly Salary (₹)
Annual Cost (₹ lakh)
Helper/Loader
2
12,000 each
2.88
Accountant
1
18,000
2.16
Watchmen
2
6,000 each
1.44
Total Annual Manpower Cost: ₹19.68 lakhs (including 10% fringe benefits)
5. 4T Oil Blending Plant Setup & Infrastructure
Land & Building Requirements
Area: 4,500-5,000 sq ft industrial shed
Location: Industrial estate in Uttarakhand (Haridwar/Dehradun)
Construction Cost: ₹6-7 lakhs for civil work
Layout: Raw material storage, blending area, filling section, quality lab, finished goods warehouse
Utilities & Infrastructure
Power Connection: 20 KW load requirement
Water Supply: Municipal/borewell connection
Drainage: Effluent treatment compliance
Fire Safety: NOC from the fire department
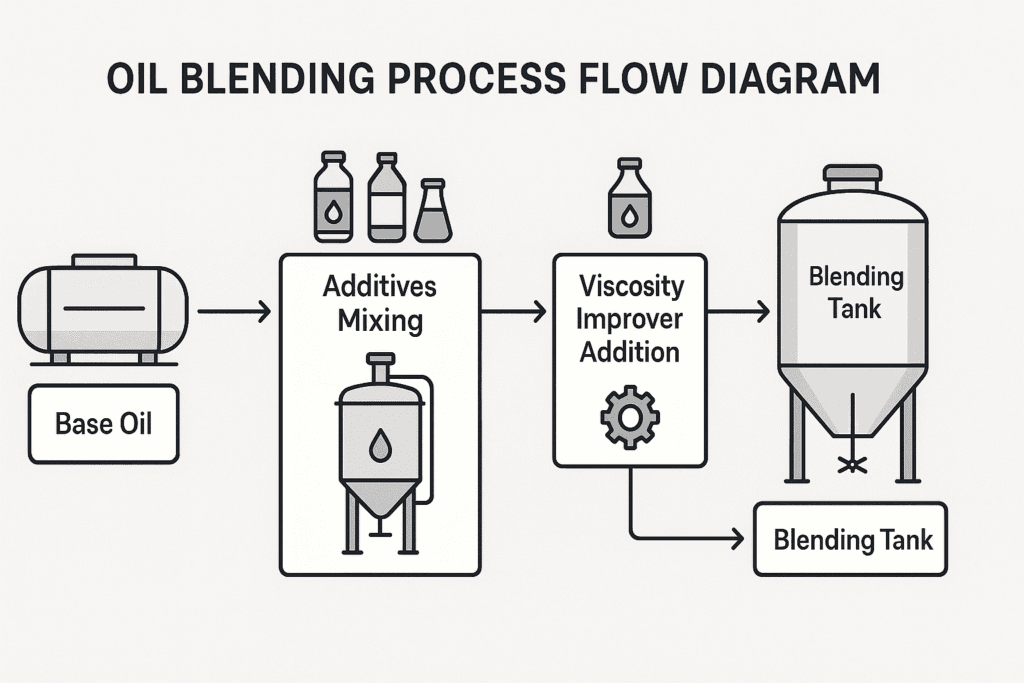
Diagram showing the 4T oil blending plant process
6. Financial Analysis & Projections
Investment Structure
Component
Amount (₹ lakhs)
Own Contribution (20%)
Bank Finance (80%)
Building & Civil Work
7.00
1.40
5.60
Plant & Machinery
11.41
2.28
9.13
Furniture & Fixtures
0.50
0.10
0.40
Working Capital
50.00
10.00
40.00
Total Project Cost
68.91
13.78
55.13
Production & Sales Projections
Year
Capacity Utilization
Production (Bottles)
Sales Value (₹ lakhs)
Net Profit (₹ lakhs)
1
50%
266,667
256.67
29.74
2
55%
293,333
308.58
32.66
3
60%
320,000
340.02
34.97
4
65%
346,667
372.00
36.68
5
70%
373,333
404.51
37.78
Profitability Metrics
Break-even: 42% capacity utilization
ROI: 43% in Year 1, increasing to 56% by Year 3
Payback Period: 2.3 years
7. Operational Costs & Utilities
Monthly Operational Expenses
Cost Component
Monthly Amount (₹)
Annual Amount (₹ lakhs)
Power (4,000 units @ ₹7/unit)
28,000
3.36
Raw Materials (50% capacity)
14,50,000
174.00
Labor & Wages
96,000
11.52
Maintenance & Repairs
42,750
5.13
Administrative Expenses
32,083
3.85
Total Monthly OPEX
15,48,833
197.86
8. Regulatory Framework & Licensing
Required Licenses & Registrations
GST Registration: Mandatory for business operations
MSME Udyog Aadhaar: Online registration for incentives
Pollution Control Board: Environmental clearance
Fire Department NOC: Safety compliance
Trademark Registration: Brand name protection
IS Standards: Quality certification compliance
Uttarakhand State Incentives
Capital Subsidy: Up to 25% on fixed capital investment
Interest Subsidy: 5% on term loans for 5 years
Power Tariff Subsidy: 50% for the first 3 years
Stamp Duty Exemption: On land purchase/lease agreements
9. Marketing & Distribution Strategy
Pricing Strategy
900 ML Bottle: ₹105-₹110 (retail price)
Bulk Sales: ₹85-₹95 per bottle (to distributors)
Profit Margin: 35-40% at the retail level
Distribution Channels
Direct Sales: To auto service centers and garages
Distributor Network: Regional distributors in key markets